Data plotting, wrangling, and aggregation
ITEC 3160 Programming for Data Analysis,
Cengiz Günay
(License: CC BY-SA 4.0)
Data plotting
- See Python for Data Analysis, Chapter 9
Main library is matplotlib:
- Controls how figures are laid out and decorated (axes, labels, colors, line styles, etc)
- Can be used directly
- Pandas uses it indirectly, but allows using
matplotlibcommands
Anatomy of a plot in matplotlib
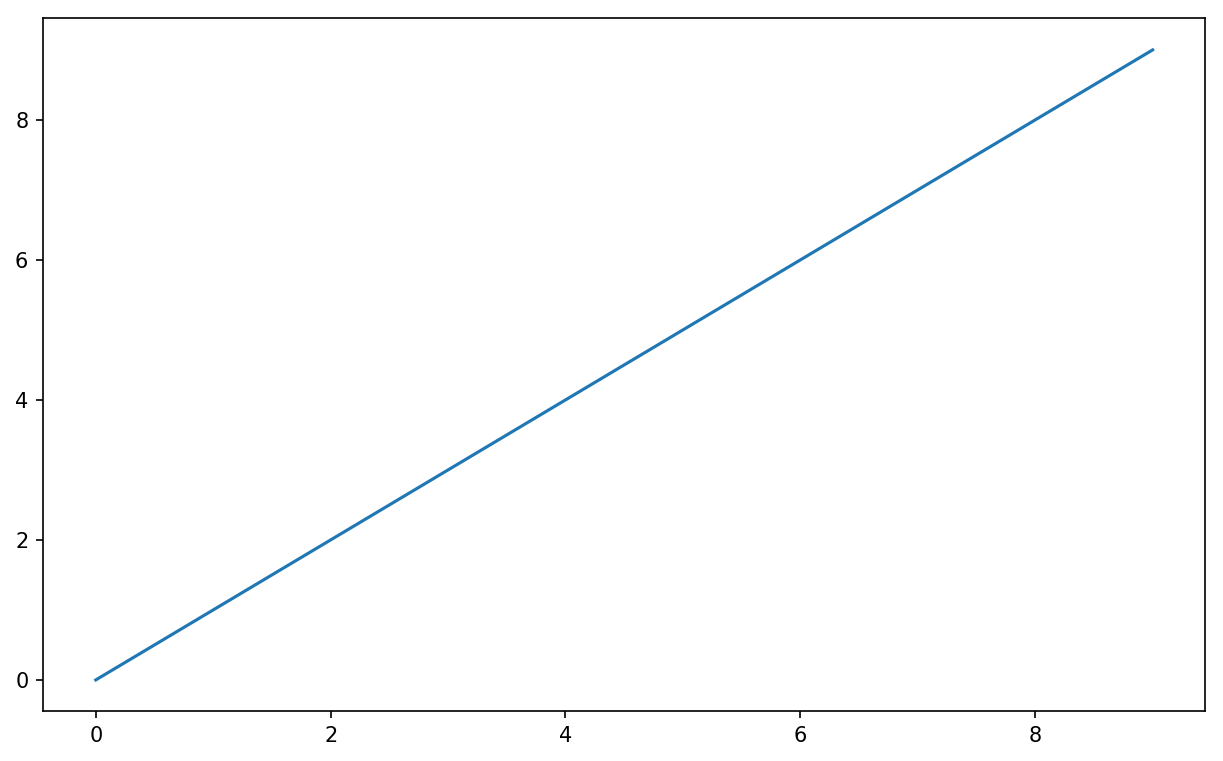
- figure: The graphical area for one figure
- axis: Labeled axis for XY, can be superimposed or tiled
- plot: Individual shapes (lines, rectangles, etc) drawn on an axis
Types of Plots
- line and scatter graphs
- bar graphs and distributions (histogram vs density)
- other statistics (boxplots)
- image plots (matplotlib commands )
- surface plots (matplotlib commands )
Data wrangling
- See Python for Data Analysis, Chapter 8
Hierarchical indexing:
- partial indexing
unstack()method converts toDataFramestack()is the reverseswaplevel()for reordering hierarchical indicessort_index()for sorting by one index- Summary statistics with vector operators, such as
sum(level=, axis=)
Combining and merging
merge()by using keys (indices) like the SQL join operator- inner, left, right, and outer joins possible
concat()for stacking objects
Reshape and pivot
stack/vsunstackreshape- “long” vs “wide” format
pivotvsmelt
Data aggregation
- See Python for Data Analysis, Chapter 10
- Section 10.2 lists common aggreagate functions
Section 10.3 Groupby: split-apply-combine
- another way of doing
groupby - selecting column(s) and index levels
- aggregation functions
apply()arbitrary functions
Section 10.5: Pivot tables and cross-tabulation
pivot_table: Equivalent topivotbefore, but good examples.crosstab: Special case of pivot that shows counts.