Working with vector data
ITEC 3160 Programming for Data Analysis,
Cengiz Günay
(License: CC BY-SA 4.0)
Prev - Data structures and performance, Next - Data input/output and cleaning
Jupyter notebooks in Python
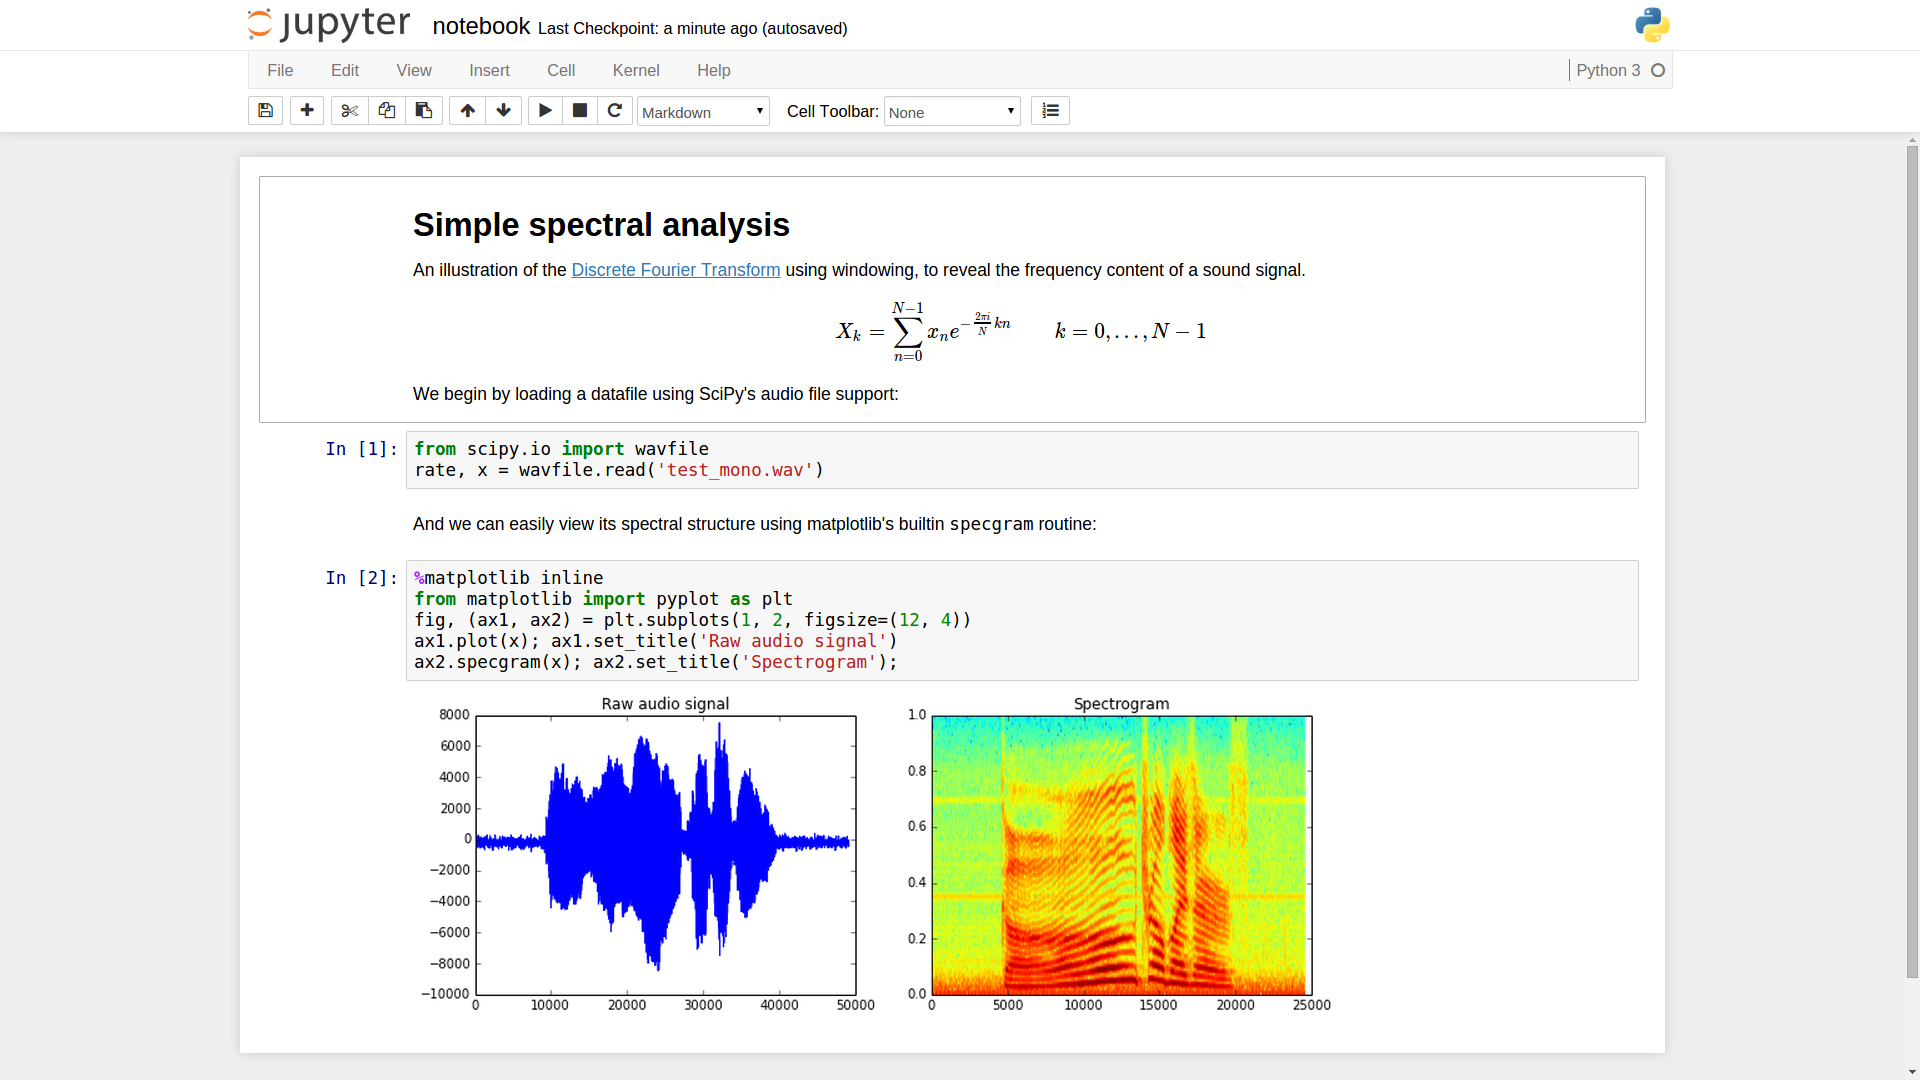
How to use Jupyter?
- Jupyter
is included in the Anaconda
distribution
- Start Anaconda from menu or run
anaconda-navigatoron command line - Install the Jupyter Notebook application in Anaconda
- If it’s already installed, click on Launch to start it
- JupyterLab provides an integrated environment, similar to R Studio or Matlab
- Start Anaconda from menu or run
- Without installing, online notebooks are available at Google Colab , DeepNote , and Azure Notebooks
- Try notebooks in your browser:
Block execution
Follow sections on the official Notebook Examples tutorial:
- Structure of notebook documents
- Kernels, cell types: markdown vs code
- Navigation, running code
- Order of execution
Practice! Open a Jupyter notebook and follow along
Do ONE of the following:
- Open online notebook at Google Colab , DeepNote , or Azure Notebooks
- Or download Anaconda and run Jupyter Notebook or JupyterLab
- Use Visual Studio Code with its regular Python extension
- Use JupyterLite (doesn’t save across browsers or computers - not a cloud service!)
Python’s Numpy module
From Python for Data Analysis, 2nd Ed, chapter 4 :
- enables working with $n$-dimensional arrays
- math functions without needing to loop over arrays
- 10-100x faster than using regular Python
- reading/writing to files
- advanced math: linear algebra, random numbers, etc
How do dimensions work?
1 dimension: 1 bracket, 1 index
arr1d = np.array([1, 2, 3])
arr1d[x]
2 dimensions: 2 brackets, 2 indices
arr2d = np.array([[1, 2, 3],
                  [4, 5, 6]])
arr2d[x, y]
3 dimensions: …
arr3d = np.array([[[ 1,  2,  3],
                   [ 4,  5,  6]],
                  [[ 7,  8,  9],
                   [10, 11, 12]]])
arr3d[x, y, z]
Numpy overview
- Creating and manipulating
ndarrayobjects and doing math on them - Data types for efficient storage and use
- Indexing and slicing; with boolean expressions and fancy indexing
- Unary and binary math functions
Numpy practice
Start by working in teams on the whiteboard and
then submit
individually by forking
this
or create an
online notebook.
Option 1
Solve ONE of these problems (thanks math people!):
Make sure to:
- Use numpy arrays and arithmetic operations in page below
Option 2
Do 3 examples of each below and briefly explain each with one sentence:
- Create numpy arrays in 1D, 2D, and 3D
- Index slices in 1D, 2D, and 3D
- Do some arithmetic
- Use Boolean indexing
Linear algebra basics:
Vectors and matrices
Basics: Vectors
Vectors: $\vec{x} = [ 1, 2, 3 ]$
- Why? Most data comes in vectors
Can do bulk operations using math magic:
- Adding or subtracting a scalar: $$ \vec{x} + 1 = [ 2, 3, 4 ] $$
- Multiplying or dividing by a scalar: $$ \vec{x} \times 2 = [ 2, 4, 6 ] $$
- Adding two vectors (of same size): $$ \vec{x} + \vec{x} = [ 2, 4, 6 ] $$
Vector math: dot product
inner/dot product : $$ \vec{x} \cdot \vec{y} = \sum x_i y_i $$
- Calculates “length of projection” in geometric sense
- Multiply corresponding elements and sum to result in scalar
- Useful in calculating weighted sums, scaling data elements, etc.
Example: sum of products to find total price
quantity = np.array([1, 1, 5, 2])
prices = np.array([10, 15, 1.25, 20])
total = np.dot(prices, quantity)
Result: 71.25
Vector math: outer product
$$ \vec{x} \times \vec{y} = [x_i y_j]_{ij} $$
- element-by-element multiplication, results in $ n \times m $ size matrix
- useful when duplicating rows or columns, or scaling them
Example:
item_prices = np.full((1,5), 50) # all $50
inflation_per_month = np.array([1.1, 1.3, 1.3, 1.4]) # monthly inflation
new_prices_per_month = np.outer(inflation_per_month, item_prices)
Result:
array([[55., 55., 55., 55., 55.],
       [65., 65., 65., 65., 65.],
       [65., 65., 65., 65., 65.],
       [70., 70., 70., 70., 70.]])
Basics: Matrices
$$ A=\left[ \begin{array}{ccc} a_{11} & \cdots & a_{1n} \newline \vdots & \ddots & \vdots \newline a_{m1} & \cdots & a_{mn} \newline \end{array} \right] $$
Uses:
- Aggregation of many vectors
- Bases for transformation spaces
- Image data and manipulation
Matrix multiplication
Must have matching inner dimensions, results in a matrix: $$ A_{m\times n} \times B_{n\times o} = C_{m\times o} $$
Each element of output matrix is the result of one inner product: $$ c_{ij} = \sum_k a_{ik} b_{kj} $$
Rows of $A$ matched to columns of $B$ to create single elements of $C$: $$ \left[ \begin{array}{c} \bbox[5px,yellow,border:2px solid red]{\begin{array}{ccc} a_{11} & \cdots & a_{1n} \end{array}} \newline \begin{array}{ccc} \vdots & \ddots & \vdots \newline a_{m1} & \cdots & a_{mn} \newline \end{array} \end{array} \right] \times \left[ \begin{array}{cc} \bbox[5px,yellow,border:2px solid red]{\begin{array}{c} b_{11} \newline \vdots \newline b_{n1} \end{array}} & \begin{array}{cc} \cdots & b_{1o} \newline \ddots & \vdots \newline \cdots & b_{no} \newline \end{array} \end{array} \right] = \left[ \begin{array}{ccc} \bbox[5px,yellow,border:2px solid red]{c_{11}} & \cdots & c_{1o} \newline \vdots & \ddots & \vdots \newline c_{m1} & \cdots & c_{mo} \newline \end{array} \right] $$
Uses of matrix algebra
- Useful transforming rows of data, image operations, 3D rotations, machine learning, etc.
- Google’s PageRank algorithm
is:
[…] calculated using a simple iterative algorithm, and corresponds to the principal eigenvector of the normalized link matrix of the web. (from original paper )
- Inverse of a matrix can be calculated to satisfy: $$ A\times A^{-1} = I$$
- Solving linear sets of equations: $$Ax+b=y$$
NumPy: conventional looping versus vector operations
Loop through your data and calculate mean and standard deviation (or regression, min, max, etc.).
vector = [1,2,3]
sum = 0
for element in vector:
    sum += element
mean = sum / len(vector)
Use vector operations to do it shorter and more efficiently. $$ \mu = \sum_{i=1..N} x_i / N $$
import numpy as np
vector = np.array([1,2,3])
mean = np.sum(vector) / len(vector)
Numpy exercise 1
Use vectorized numpy operations to calculate standard deviation $$ \sigma = \sqrt{ \sum_{i=1..N} ( x_i - \mu )^2 / ( N - 1 ) } $$ where $N$ is the number of elements in $ \vec{x} $ and $ \mu $ is its mean.
Practice with team on whiteboard/laptop this and the two exercises below.
Numpy exercise 2
Use the dot product to calculate total miles covered by all cars:
road_milesgives a list of different road segments and their lenght in miles.cars_roadsgive the number of cars that passed on each of the road segments.
Example:
road_miles = [108, 5, 10, 52]
cars_roads = [543, 433, 104, 390]
Numpy exercise 3
We expect the population to increase by 3% every year. Make a matrix of predictions for each county for the next three years by using:
ga_populationis a list of population numbers (in thousands) for each county.
Example:
# dekalb, fulton, gwinnett
ga_population = [757, 1065, 964]
Make a Colab notebook with your solution
- Do all 3 exercises individually
- Log into Google Colab with any Google account
- Create a new Python notebook
- Write some text and code blocks to explain your standard deviation code
- Compare your result to the output of
np.std(vector, ddof=1)in your notebook - Put additional blocks for exercise 2 and 3
- Click on Share and paste your link on Piazza
Pandas supports tabular data
- https://pandas.pydata.org/
- Akin to spreadseets and SQL tables
- Based on Numpy, but builds on it
- Primary components:
SeriesandDataFrame - Continue with Python for Data Analysis, chapter 5
Pandas objects:
- Series for 1-D data
- DataFrame for 2-D data
- Indexing (brackets,
.loc, and.iloc) - Filtering
Hands on activity
- Work in groups, but submit individually
- Use an online notebook; such as Google Colab - log in with any Google account
- Create a new Python notebook
- Create a
Dataframeobject from any data - Extract a
Seriesobject from your DataFrame- Add a string index and show indexing example
- Extract
ndarrayobject and show indexing example
- Use slicing and fancy indexing to get subsets of your
DataFrame - Apply one comparison operator to use boolean indexing on your DataFrame
- Share your link on Piazza